Responsive calendar with weekday and time-of-day analytics
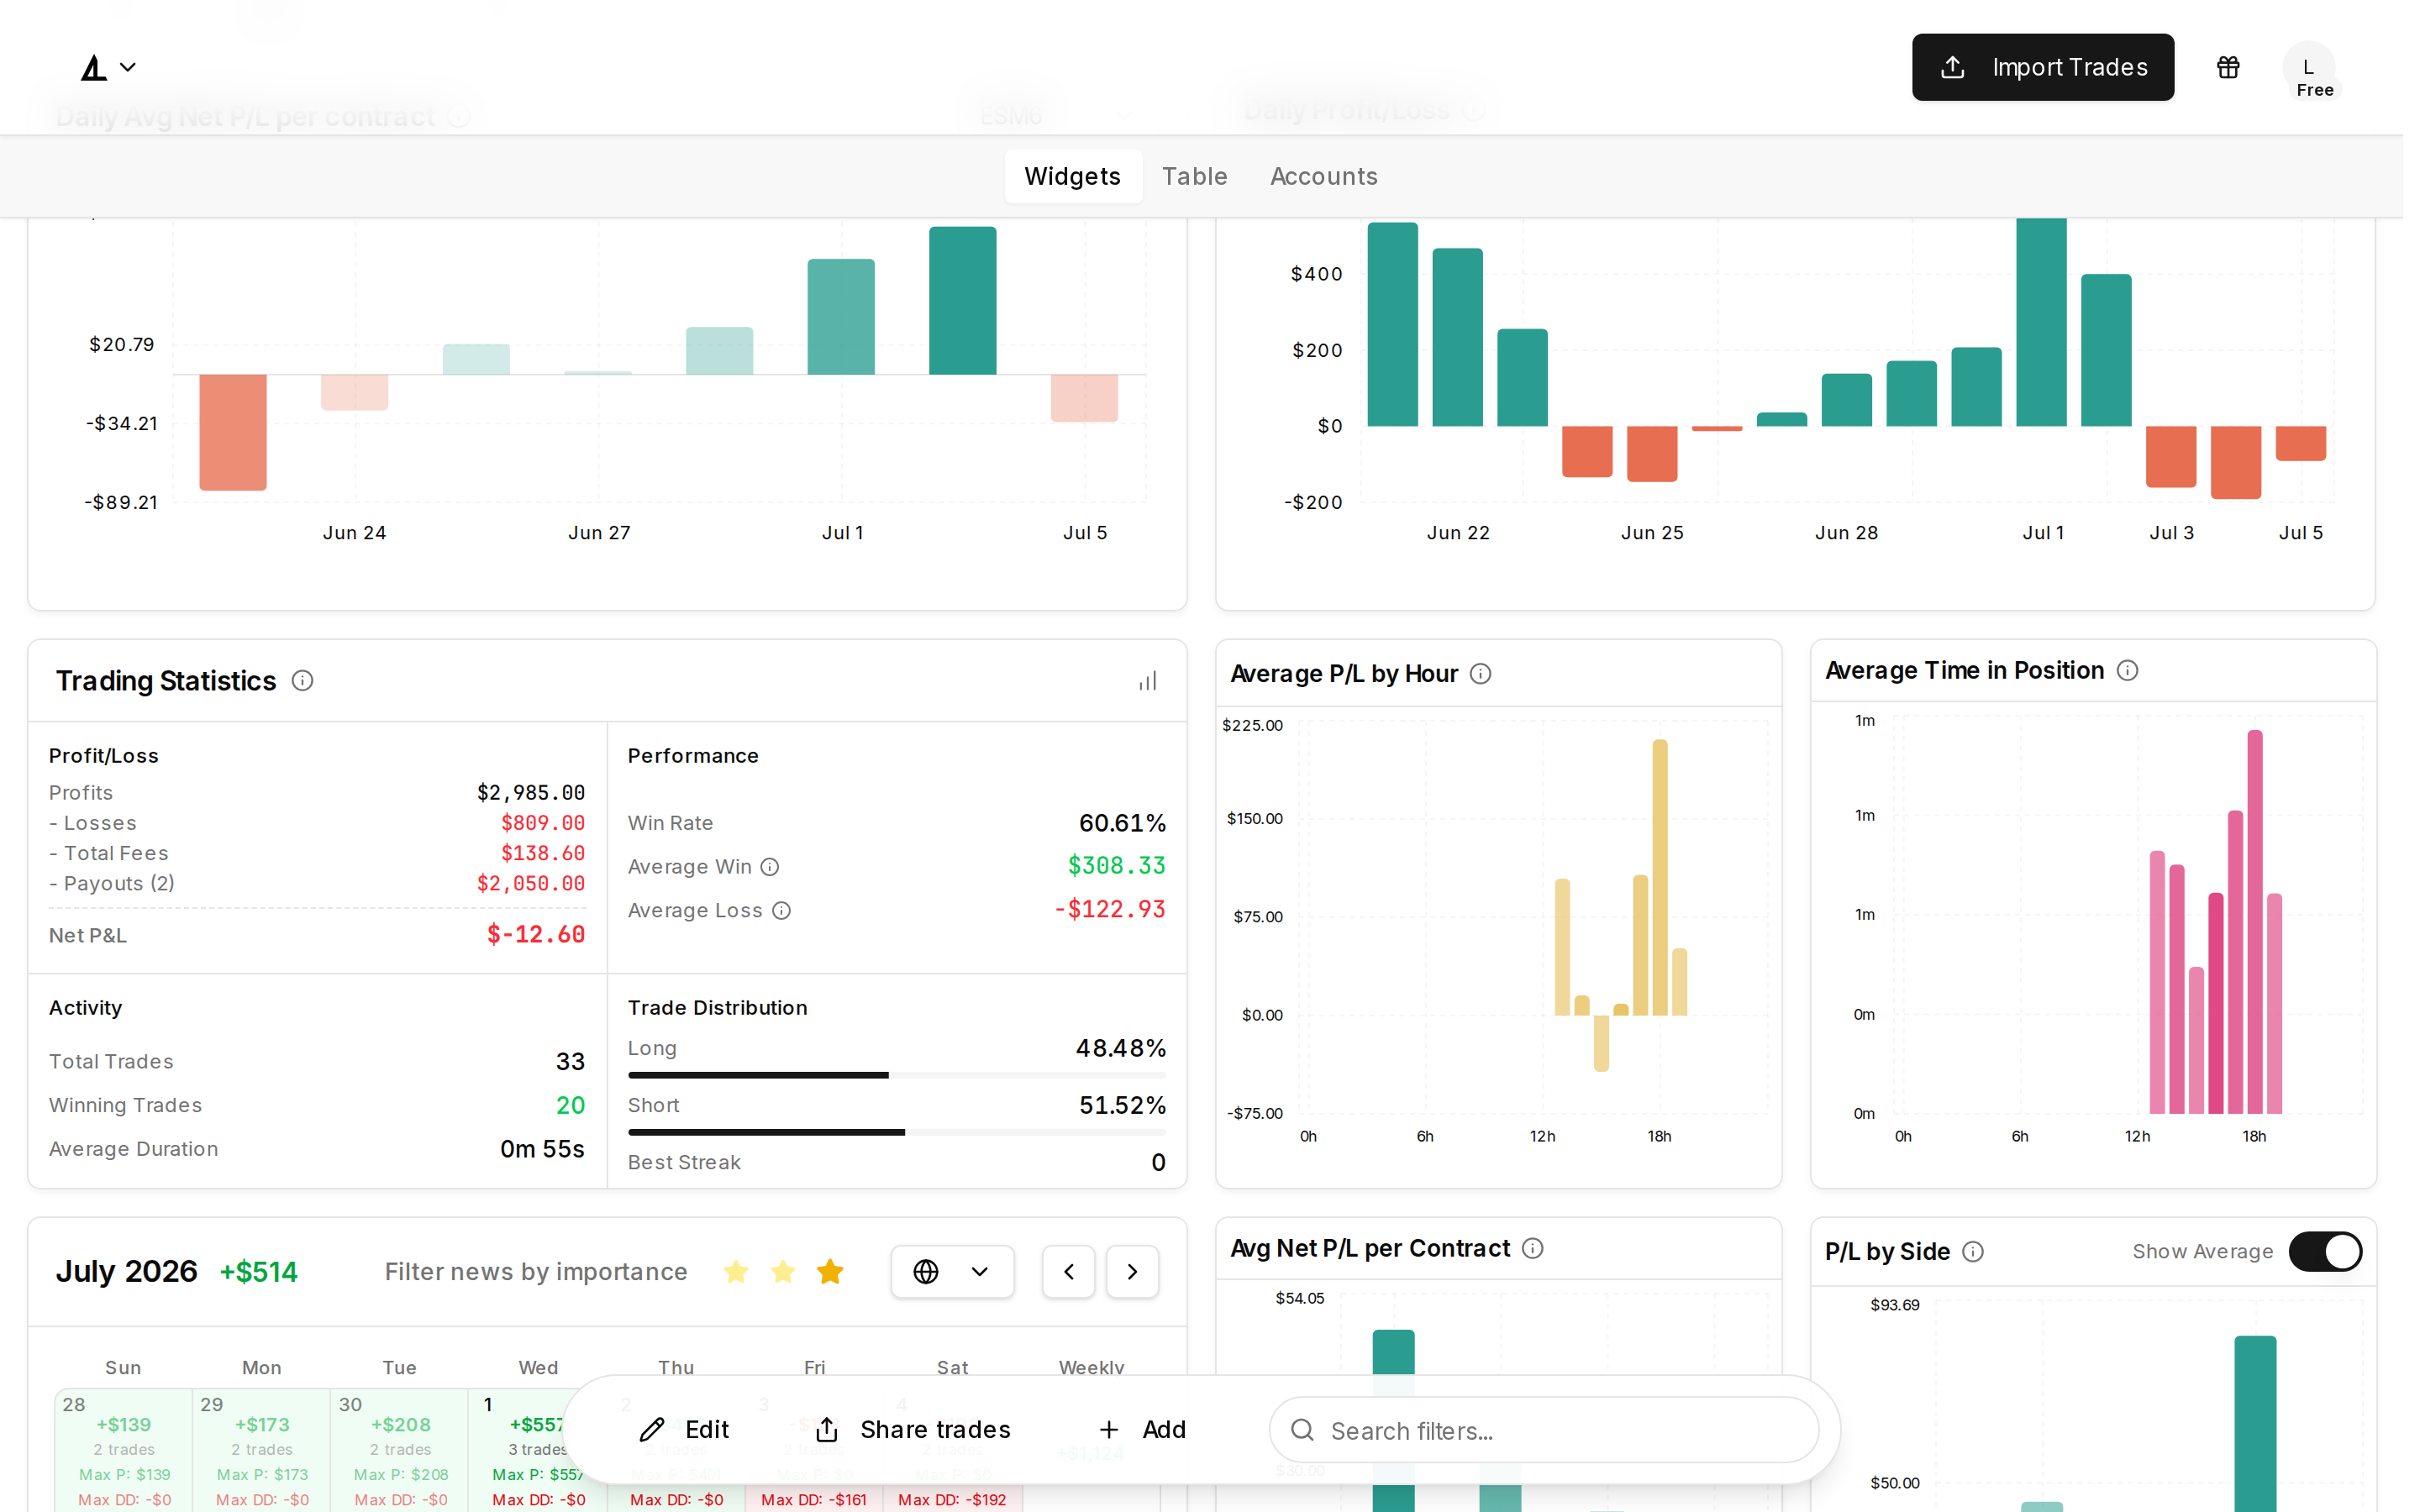
Understand when you trade best with analytics that break down performance by day of week and time of day.
How it works
A single responsive calendar scales to your screen. On mobile, you see the same calendar with compact formatting—abbreviated currency and tighter cells. On desktop, you also get weekly totals, max profit/drawdown stats, and news filters. Tap or click any day to see detailed trade information.
Key capabilities
- Responsive layout: One calendar on every screen, with compact currency and cells on mobile
- Desktop extras: Weekly totals, max profit/drawdown, and news filters on larger screens
- Weekday PnL chart: See which days of the week are most profitable for you
- Time-of-day chart: Identify your best trading hours
- Daily modal: Click any day to view all trades, stats, and notes
Weekday analysis
The weekday chart aggregates your P&L by day of the week. Quickly see if you perform better on certain days, helping you decide when to trade more aggressively or take breaks.
Time-of-day analysis
The hourly chart shows your performance across trading hours. Identify your peak performance windows and times when you should avoid trading.